Австралийцы тихо перестали ездить в Америку. Вот куда они отправились вместо этого

Главное
- 1
- 2
- 3
+3 ещё в конце статьи
Вы сравниваете билеты в Лос-Анджелес для поездки, которую собирались забронировать уже два года, а тариф почти не изменился. Изменилось только поведение всех остальных. Проверьте официальные данные правительства, и перед вами предстанет не просто ощущение, а наглядный график.
Данные Австралийского бюро статистики показывают, что краткосрочные возвращения резидентов из США примерно на 35,6% ниже уровня 2019 года, в то время как возвращения из Японии примерно на 90,1% выше его. Согласно собственным финансовым показателям АБС за 2024-25 годы, Япония (910 640 поездок) впервые в истории обошла США (746 220), причем США остаются единственным направлением из первой пятерки Австралии, чей объем до сих пор не восстановился до уровня времен до пандемии. Измеримая часть ответа на вопрос «почему» выглядит неоднозначно: австралийский доллар не ослаб по отношению к американскому с 2019 года, поэтому курс обмена не объясняет спад поездок в США, но он вырос примерно на 46% по отношению к иене, что как раз многое объясняет в популярности Японии. Въездная пошлина в США для австралийцев выросла на 90% в сентябре 2025 года. Остальные факторы, такие как настроения на границе и проверки, реальны и задокументированы, но данный массив данных не позволяет их измерить.
График, который больше никто не построил
Каждый месяц АБС публикует данные по международным прибытиям и отправлениям в Австралию (Overseas Arrivals and Departures, Australia) - это ежемесячный подсчет всех краткосрочных поездок жителей Австралии с разбивкой по странам, куда они реально отправились. Это бесплатно, это в открытом доступе, и почти никто за пределами туристической индустрии не заглядывает в Таблицу 9. Вот что там говорится.
АБС публикует «сырые» цифры каждый месяц. Никто не сопоставляет их с 2019 годом и не выстраивает все основные направления в ряд друг за другом. Именно этот пробел восполняет данная статья, а методология приведена ниже, чтобы вы могли переспроверить всё самостоятельно.
В финансовом 2024-25 году (с июля 2024 по июнь 2025 года) первая пятерка направлений по версии самой АБС выглядела так: Индонезия, Новая Зеландия, Япония, США, Китай. В этом предложении кроется главная новость. Япония обогнала США в качестве третьего по популярности направления для Австралии: из Японии вернулось 910 640 резидентов против 746 220 из США. АБС прямо заявляет: «Япония обогнала США в качестве третьего по популярности направления: в 2024-25 годах из Японии вернулось 910 640 резидентов (по сравнению с 746 220 для США)».
Но в этом же релизе есть строчка, которую легко упустить и с которой трудно спорить: среди пяти главных направлений США оказались единственным, где объемы путешествий были ниже, чем 10 лет назад: в 2024-25 годах поездок было на 253 220 меньше, чем в 2014-15 годах. Индонезия, Япония и Китай уже превзошли свои объемы времен до пандемии. США - нет.
Насколько сильно США отстают от 2019 года на самом деле?
Собственное сравнение АБС год к году полезно, но оно не показывает положение направлений относительно последнего «нормального» года до того, как пандемия перевернула все туристические маршруты на планете. Поэтому мы построили такое сравнение сами, напрямую из собственного набора данных АБС.
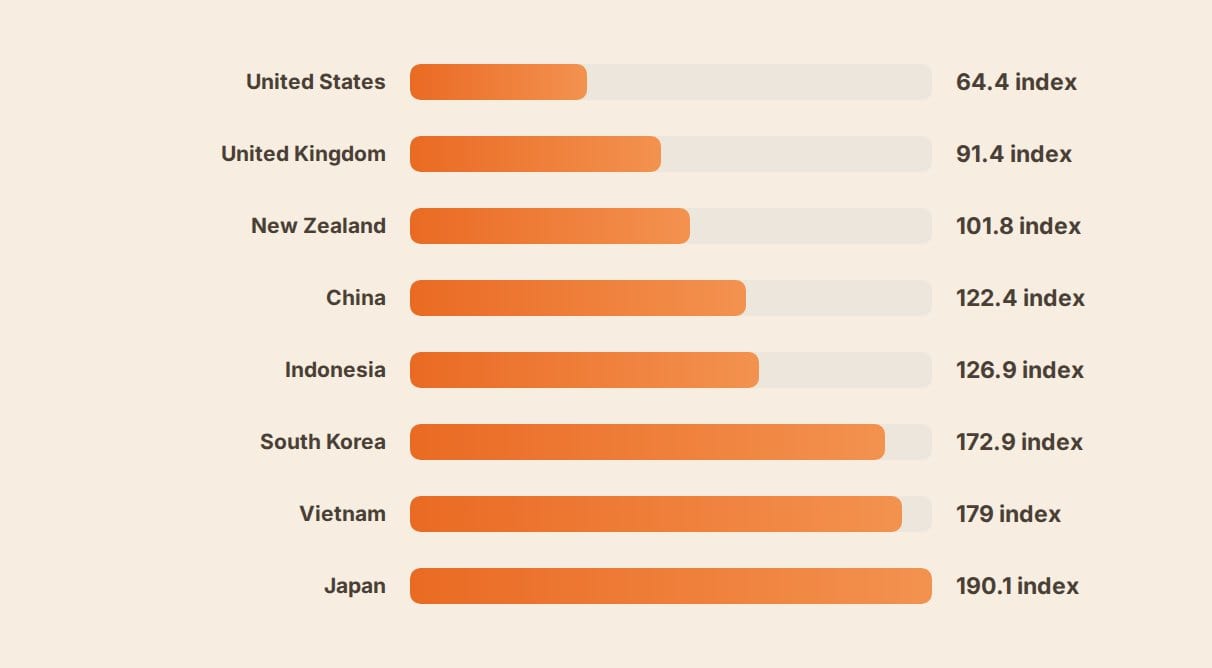
Данные: abs.gov.au, abs.gov.au
Вот методология целиком, чтобы вы могли её проверить.
- Источник Скачана Таблица 9 «Краткосрочные перемещения, возвращающиеся резиденты - отдельные направления» из публикации за июнь 2026 года, самой свежей из опубликованных.
- Базовый уровень Ссуммированы 12 месяцев календарного 2019 года для каждого направления как последнего полного и неискаженного года в истории.
- Текущий период Ссуммированы последние 12 доступных месяцев: с июля 2025 по июнь 2026 года включительно.
- Индекс Текущий период разделен на базовый показатель 2019 года для каждого направления, при этом 2019 год принят за 100.
- Почему использованы исходные суммы, а не тренд Использованы ряды исходных месячных данных, а не ряды тренда или сезонно сглаженные ряды от АБС, поскольку в собственных методологических заметках АБС подтверждается, что эти ряды были приостановлены в феврале и апреле 2020 года соответственно из-за пандемии и так и не были полностью восстановлены для данного периода.
- Перекрестная проверка Подтверждено, что суммы за финансовый год из того же файла точно воспроизводят собственные опубликованные АБС показатели финансового 2024-25 года, прежде чем доверять любым другим цифрам.
| Направление | 2019 (базовый уровень) | Июль 2025 - Июнь 2026 | Индекс (2019 = 100) |
|---|---|---|---|
| Соединенные Штаты | 1 055 600 | 679 590 | 64,4 |
| Великобритания | 663 430 | 606 090 | 91,4 |
| Новая Зеландия | 1 462 830 | 1 489 460 | 101,8 |
| Китай | 607 730 | 743 970 | 122,4 |
| Индонезия | 1 400 720 | 1 777 280 | 126,9 |
| Южная Корея | 84 260 | 145 680 | 172,9 |
| Вьетнам | 317 090 | 567 460 | 179,0 |
| Япония | 522 160 | 992 550 | 190,1 |
| Все направления | 11 308 900 | 12 711 640 | 112,4 |
Взгляните на столбец индекса - картина предельно ясна. Два направления до сих пор находятся ниже показателей 2019 года, причем отстают на совершенно разную величину. США находятся на 35,6% ниже своего объема 2019 года. Великобритания просела на 8,6% - это заметный спад, но не крах. Все остальные направления в таблице уверенно идут в плюсе, а выездной туризм из Австралии в целом вырос на 12,4% по сравнению с допандемийным периодом. Япония находится на 90,1% выше своего объема 2019 года, то есть выросла почти вдвое. Южная Корея и Вьетнам отстают от темпов Японии ненамного.
Наше собственное воспроизведение цифр АБС полностью совпало с их опубликованными показателями за финансовый год (746 220 для США, 910 640 для Японии, 12 261 080 для общего национального итога), в чем и заключается смысл демонстрации метода, а не только вывода: любой может открыть ту же электронную таблицу и получить тот же результат.
Есть еще один факт, который показывают исходные месячные данные и который не озвучивается напрямую в годовых сравнениях самой АБС: в разрезе полного календарного года Япония впервые обогнала США в 2024 году, а не в 2024-25 финансовом году. В календарном 2024 году было зафиксировано 798 710 возвращений из Японии против 735 210 из США. Это наш собственный расчет по тому же ряду из Таблицы 9, а не опубликованная АБС строчка, но в его основе лежат те же самые цифры, а это значит, что перед нами не случайный однолетний всплеск. Разрыв сохраняется уже как минимум два года подряд, причем он увеличивается, а не сокращается: только в июне 2026 года, за последний месяц в релизе, из Японии вернулось 61 650 австралийцев против 52 030 из США.
Что в причинах поддается измерению, а что нет
Именно здесь многие авторы туристических заметок начинают лениться и назначают кого-то виноватым. Мы так поступать не будем, поскольку честный ответ заключается в том, что некоторые конкурирующие объяснения можно проверить по точным цифрам, а другие - нет.
Обменный курс не объясняет ситуацию с США
Все обменные курсы и переводы в австралийские доллары в этом разделе актуальны по состоянию на сентябрь 2026 года - месяц, когда эта статья проверялась и публиковалась.
Самое распространенное предположение сводится к тому, что австралийский доллар ослаб, из-за чего поездки в США стали дороже. Проверьте собственные данные Резервного банка Австралии по обменным курсам, и это предположение не подтвердится. В 2019 году австралийский доллар в среднем стоил 0,6962 доллара США. По состоянию на 9 сентября 2026 года его курс составляет 0,7232 доллара США, что означает его небольшое укрепление по отношению к доллару США по сравнению со средним показателем 2019 года, а не ослабление.
| Валютная пара | Среднее за 2019 год | 9 сентября 2026 года | Изменение |
|---|---|---|---|
| AUD/USD | USD 0,6962 | USD 0,7232 | +3,9% |
| AUD/JPY | JPY 75,90 | JPY 110,85 | +46,0% |
Источник: Резервный банк Австралии, исторические и текущие обменные курсы F11.
С Японией ситуация обстоит ровно наоборот, и это сильнейший из всех измеримых факторов в данном материале. В среднем в 2019 году за один австралийский доллар давали 75,90 иены. 9 сентября 2026 года за него дают 110,85 иены - примерно на 46% больше иен за те же австралийские доллары. Порция рамена стоимостью 3 000 иен (около 27 австралийских долларов по курсу сентября 2026 года) в ценах 2019 года обошлась бы примерно в 40 австралийских долларов. Это не просто атмосфера. Это арифметика, и это самое очевидное объяснение того, почему именно Япония, а не «Азия» в целом, приняла на себя такую большую долю перенаправленного туристического потока.
Реальное, датированное увеличение расходов, но небольшое
Австралия путешествует в США без визы по Программе безвизового въезда (Visa Waiver Program), что означает необходимость оформления разрешения ESTA, а не визы. 30 сентября 2025 года сбор за ESTA вырос с 21 до 40 долларов США, то есть примерно на 90%, в рамках изменений пошлин, связанных с законом о приведении бюджета в соответствие за 2025 финансовый год, известным как H.R. 1. Проверяйте актуальную стоимость перед оплатой только на официальном сайте подачи заявлений ESTA, никогда не пользуйтесь сторонними сайтами, которые взимают сервисную наценку сверху. В пересчете на австралийские деньги это означает, что сумма выросла с примерно 29 австралийских долларов до примерно 55 по сегодняшнему курсу - это реальные расходы, но они невелики на фоне стоимости авиабилета, которая исчисляется четырьмя знаками. Об этом полезно знать перед бронированием. Сама по себе эта сумма не является причиной исчезновения трети рынка.
Сбор за ESTA для австралийцев: от 21 до 40 долларов США (примерно от 29 до 55 австралийских долларов по курсу на сентябрь 2026 года), введено с 30 сентября 2025 года. Разовый расход на поездку, а не ежегодный платеж с человека.
Задокументировано, но не поддается оценке в рамках этого набора данных
Собственные рекомендации Smartraveller для США по состоянию на их последнюю проверку в сентябре 2026 года находятся на самом низком уровне: «проявляйте обычные меры предосторожности». Это не предупреждение. Но в тех же рекомендациях прямо указано, что сотрудники пограничной службы США «обладают широкими полномочиями решать, имеете ли вы право на въезд», и могут отказать во въезде по самым разным причинам, что кардинально отличается по формулировкам от версии тех же рекомендаций до 2020 года.
С американской стороны в докладе Исследовательской службы Конгресса США от июля 2025 года перечисляются факторы, на которые наблюдатели указывают как на причину общего замедления международного въездного потока в США: «длительное ожидание собеседования на визу, более строгая пограничная и иммиграционная политика, потенциальные пошлины, сила доллара и ограничения на поездки в США для определенных стран». В этом же докладе отмечается, что в 2024 году число иностранных посетителей США достигло 72,4 миллиона человек, что по-прежнему не дотягивает до 79,4 миллиона, зафиксированных в 2019 году, а прибытия за год по май 2025 года снизились на 2,4% по сравнению с предыдущим годом. Ничто из этого не относится исключительно к Австралии, и в докладе не выделяется отдельный показатель по австралийцам. Это реальный официальный факт, но мы просто не можем привязать эту цифру конкретно к австралийцам, не выдумывая её. Поэтому мы и не будем этого делать.
Пропускная способность авиакомпаний на маршруте Австралия - США также заслуживает упоминания, причем ситуация здесь носит противоречивый характер, а не просто идет на спад. Данные Бюро инфраструктуры, транспорта и региональной экономики (BITRE) по международной деятельности авиакомпаний отслеживают рейсы и доступные места в разбивке по странам, а отчеты об изменениях конкретных маршрутов в 2026 году показывают, как перевозчики сокращают одни пары городов (рейс Мельбурн - Даллас был отменен, Брисбен - Чикаго приостановлен) и одновременно наращивают провозные емкости на других направлениях той же сети. Мы не смогли вычленить единый чистый показатель количества мест на рейсах между Австралией и США для этой статьи из собственных данных АБС, поэтому мы упоминаем этот фактор в качестве возможного объяснения и оставляем его в таком виде, не привязывая к нему конкретную цифру.
Почему именно Япония

Фото: Марко Альмбауэр (Marco Almbauer) · CC BY-SA 4.0 через Wikimedia Commons
Если отбросить валютный эффект, у Японии всё равно остаются два преимущества, которых нет у США: география и новизна. Лететь туда с восточного побережья Австралии ближе, чем до континентальной части США, из нескольких австралийских городов отправления выполняются прямые рейсы, и для огромной доли австралийских путешественников это всё еще первая поездка, а не повторная. Индонезия годами удерживала первое место по популярности исключительно за счет дешевизны и близости (ознакомьтесь с нашим руководством по требованиям для въезда на Бали для австралийцев, если вы планируете именно такую поездку). Япония делает нечто более редкое: она превращает слабую валюту в устойчивую новую привычку, а не просто в дешевую разовую поездку.
Китай демонстрирует аналогичную тенденцию в меньших масштабах (рост на 22,4% к 2019 году), чему способствует безвизовый въезд для австралийцев, срок действия которого официально истекает 31 декабря 2026 года. Южная Корея и Вьетнам, выросшие более чем на 70% по сравнению с 2019 годом, дополняют картину подлинного регионального сдвига, а не истории одной страны. Если здесь и прослеживается общая тема, то она звучит вовсе не как «все любят Японию». Она заключается в том, что Северная и Юго-Восточная Азия стали заметно дешевле и удобнее для австралийцев ровно в тот момент, когда поездки в США стали ощутимо дороже и, судя по упомянутым выше задокументированным факторам, менее предсказуемыми с точки зрения уверенности в поездке.
Что это значит, если вы как раз бронируете поездку
Всё это не повод отменять поездку в США, которую вы уже запланировали, и это не приговор какому-то конкретному городу, семейному визиту или мечте из личного списка. Это обобщенная национальная тенденция по итогам более чем 12 миллионов поездок в год. Вот как этим воспользоваться, а не просто прочитать.
Представим семью из четырех человек из Брисбена, которая выбирает между декабрьским отдыхом в Лос-Анджелесе и поездкой в Осаку. Статья расходов на ESTA для этой семьи теперь составляет около 220 австралийских долларов (4 путешественника по 40 долларов США, примерно по 55 австралийских долларов с человека) по сравнению с примерно 116 австралийскими долларами в ценах 2019 года (4 человека по 21 доллару США, примерно по 29 австралийских долларов с человека). Это вполне реальная строка расходов, которая добавляется к стоимости авиабилета, а не входит в неё. Скидка за счет иены работает иначе. Она вообще не затрагивает стоимость перелета. Она проявляется позже - в виде примерно на 46% большей суммы на личные расходы, которую те же австралийские доллары позволяют потратить на месте после прибытия на еду, отели и поезда. Одно и то же сравнение, но в двух совершенно разных местах стоимость или экономия проявляются по-разному.
- Проверьте актуальный сбор за ESTA (40 долларов США) перед бронированием, заложите его в бюджет в австралийских долларах по текущему курсу и сохраните подтверждение вместе с остальными документами из нашего контрольного списка дорожных документов
- Если вы сравниваете США с альтернативным направлением в Азии по стоимости, рассчитывайте цену перелета и наземных расходов по отдельности. Обменный курс сильнее всего помогает в повседневных тратах, а не в оплате авиабилетов
- Если Европа также входит в ваш короткий список, заранее проверьте реальные требования перед вылетом. Правила въезда для австралийцев (ETIAS, британское разрешение ETA) изменились с тех пор, как вы проверяли их в последний раз
- Не забудьте учесть собственные выездные расходы из Австралии. Сбор за перемещение пассажиров (налог при выезде) взимается независимо от того, в какую именно страну вы летите
- Если на вашем маршруте неизбежна пересадка, отдельно проверьте правила транзитной визы для этого пункта. Это требования другой страны, а не продолжение правил вашего конечного пункта назначения
Где эта тенденция не работает
Национальные сводные показатели могут скрывать за собой многое. Семейные встречи, свадьбы и деловые поездки в США не так чувствительны к цене, как обычный отпуск, а данные АБС не позволяют и не пытаются разделить цель поездки по странам так, как это сделано для Индонезии с её преобладающими туристическими показателями. Путешественник из Перта, летящий прямым рейсом в Токио, совершает совсем другую поездку и производит иные расчеты, чем тот, кто летит по маршруту Брисбен - Лос-Анджелес на выпускной к двоюродному брату. Если ваша причина для поездки неизменна, ни один из этих индексов её не отменит. Изменяется лишь решение примерно для каждого третьего австралийца, который, судя по данным, предпочел выбрать другое место.
Часто задаваемые вопросы
Действительно ли Япония обогнала США в качестве направления для австралийцев, или это один необычный год?
Это продолжается уже как минимум два года подряд. Собственные данные АБС за финансовый 2024-25 год выводят Японию на первое место (910 640 поездок против 746 220), а наше собственное воспроизведение исходных месячных данных показывает, что Япония также опережала США по итогам полного календарного 2024 года (798 710 против 735 210) и с еще большим отрывом лидирует в самом последнем месяце из доступных в статистике - в июне 2026 года.
Является ли австралийский доллар более слабым по отношению к доллару США, чем до пандемии?
Нет. В среднем в 2019 году он составлял 0,6962 доллара США, а 9 сентября 2026 года находился на отметке 0,7232 доллара США, согласно данным Резервного банка Австралии. Он стал немного сильнее, а не слабее, что исключает версию о слабости AUD как причине снижения поездок из Австралии в США.
Насколько вырос сбор за ESTA для австралийцев, путешествующих в США?
Он вырос с 21 до 40 долларов США 30 сентября 2025 года - примерно на 90% в результате положений о пошлинах в законе о бюджете за 2025 финансовый год. В пересчете на австралийские доллары это означает увеличение с примерно 29 до примерно 55 австралийских долларов по курсу сентября 2026 года, что является реальной статьей расходов, но выглядит небольшой суммой на фоне полной стоимости международного перелета.
Почему Япония сейчас обходится дешевле для австралийцев?
Главным образом из-за иены. Согласно данным РБА, теперь австралийский доллар покупает примерно на 46% больше иен, чем в среднем в 2019 году. Эта скидка сказывается на повседневных расходах, таких как еда и отели, а не на самом авиабилете, цена которого формируется в корзине разных валют и с учетом стоимости топлива.
Безопасно ли путешествовать в США жителям Австралии в настоящее время?
Общий уровень рекомендаций Smartraveller для США остается на отметке «проявляйте обычные меры предосторожности» - это самый низкий уровень опасности по состоянию на последнее обновление. При этом в тексте рекомендаций подчеркивается, что пограничные офицеры США обладают широкими полномочиями при принятии решений о допуске в страну, что является задокументированным изменением формулировок, а не снижением уровня безопасности.
Какое направление выросло сильнее всего с 2019 года среди ведущих выездных рынков Австралии?
Согласно нашему индексу, Япония лидирует среди основных направлений с показателем 190,1 (где 2019 год принят за 100), что означает, что краткосрочные возвращения превышают уровень до пандемии примерно на 90%. Вьетнам (179,0) и Южная Корея (172,9) отстают от неё совсем незначительно.
Где я могу самостоятельно проверить эти данные?
АБС публикует их ежемесячно в разделе Международные прибытия и отправления в Австралию (Overseas Arrivals and Departures, Australia). Таблица 9 «Краткосрочные перемещения, возвращающиеся резиденты - отдельные направления» представляет собой тот конкретный файл, на основе которого построен индекс в этой статье.
Главные выводы
- США - единственное из пяти крупнейших направлений Австралии, которое до сих пор находится ниже уровня 2019 года, причем с самым большим отрывом среди всех направлений. Наш индекс ставит их на отметку 64,4 при базовом уровне 2019 года, равном 100, что делает США единственным участником с отрицательным значением среди главных выездных рынков Австралии.
- Япония обогнала США по собственным данным АБС, и это не разовая случайность. В финансовом 2024-25 году было зафиксировано 910 640 поездок в Японию против 746 220 в США, причем Япония также опережает США в годовом исчислении начиная с 2024 года.
- Обменный курс объясняет популярность Японии, но не ситуацию с США. Австралийский доллар практически не изменился по отношению к американскому доллару с 2019 года, но вырос примерно на 46% по отношению к иене.
- Повышение сбора за ESTA реально (с 21 до 40 долларов США), но оно незначительно на фоне общих расходов на поездку в США. Включите его в бюджет и не вините во всём только его.
- Настроения на границе задокументированы, но не поддаются точной оценке конкретно для австралийцев. Воспринимайте это как один из факторов наряду с другими, а не как единственное объяснение.
- Какое бы направление вы ни выбрали, проверьте сбор, курс и налог перед бронированием. Инструменты вроде TripProf хранят сбор за ESTA, обменный курс и собственный выездной налог Австралии в едином файле поездки вместо пяти открытых вкладок браузера.
Источники
- Австралийское бюро статистики, Международные прибытия и отправления в Австралию, июнь 2026 г.: первичный релиз и массив данных Таблицы 9, использованный для индекса до пандемии
- Австралийское бюро статистики, Международные прибытия и отправления в Австралию, финансовый 2024-25 год: официальные данные об обгоне США Японией и сравнение за 10 лет
- Резервный банк Австралии, обменные курсы: текущие курсы AUD/USD и AUD/JPY
- Резервный банк Австралии, исторические обменные курсы F11: средние значения обменных курсов за базовый 2019 год
- Департамент иностранных дел и торговли: требования по программе ESTA и безвизовому въезду для австралийцев
- Smartraveller, рекомендации для путешествий в США: текущий уровень рекомендаций и правила въезда на границе
- Исследовательская служба Конгресса, Последние тенденции в международном туризме в Соединенных Штатах, 31 июля 2025 г.: задокументированные факторы и общемировые тенденции прибытий в США
Продолжайте читать
Другие советы и путеводители, подобранные для вас
What counts as visiting a state? Layovers, drive-throughs and the rules 50-staters use
Only 2% of Americans name a plane change as the minimum that counts as visiting a state, while 27% set the bar at driving through. Here's a three-tier rubric, a lookup table for the edge cases from Four Corners to D.C., and one trip counted three ways.

Поддельный сайт билетов SBB ворует данные банковских карт и Twint у путешественников
Кантональная полиция Цюриха подтвердила, что мошеннический сайт по продаже билетов SBB крадет реквизиты кредитных карт и платежной системы Twint у туристов, которые находят его через обычный поиск в Google. Рассказываем, как его распознать и что делать, если вы уже совершили платеж.

Предупреждение о мошенничестве с UK ETA: фальшивые сайты берут с австрийцев до 900 евро
Поддельные сайты UK ETA берут с путешественников из Австрии и ЕС сотни евро за оформление документа, который стоит 20 фунтов. Рассказываем, как работает официальный сайт и как распознать мошенников до оплаты.