Australians Have Quietly Stopped Going to America. Here's Where They Went Instead

Key Highlights
- 1
- 2
- 3
+3 more in the takeaways below
You're comparing flights to Los Angeles for a trip you've been meaning to book for two years, and the fare hasn't moved much. What's changed is everyone else. Check the government's own numbers and the story isn't a feeling. It's a chart.
Australian Bureau of Statistics data shows short-term resident returns from the United States are running about 35.6% below their 2019 level, while returns from Japan are running about 90.1% above it. In the ABS's own 2024-25 financial year figures, Japan (910,640 trips) passed the USA (746,220) for the first time on record, and the USA is the only one of Australia's top five destinations still below its pre-COVID volume. The measurable part of "why" is a mixed picture: the Australian dollar hasn't weakened against the US dollar since 2019, so exchange rate doesn't explain the US decline, but it has gained roughly 46% against the yen, which does explain a lot of Japan's pull. A US entry fee for Australians rose 90% in September 2025. The rest, border sentiment and screening, is real and documented but not something this dataset can size.
The Chart Nobody Else Has Built
Every year, the ABS publishes Overseas Arrivals and Departures, Australia, a monthly count of every short-term trip Australian residents take, broken down by the country they actually went to. It's free, it's public, and almost nobody outside the tourism industry reads Table 9. So here's what it says.
The ABS publishes the raw numbers every month. Nobody indexes them against 2019 and lines every major destination up side by side. That's the gap this article fills, and the method is below so you can rebuild it yourself.
In the 2024-25 financial year (July 2024 to June 2025), the ABS's own top-five list read: Indonesia, New Zealand, Japan, the USA, China. Buried in that sentence is the actual news. Japan overtook the USA as Australia's third most popular destination, with 910,640 residents returning from Japan against 746,220 for the USA. The ABS states it plainly: "Japan overtook the USA as the third most popular destination, with 910,640 residents returning from Japan in 2024-25 (compared to 746,220 for the USA)."
But there's a line in that same release that's easy to miss and hard to argue with: of the top five destinations, the USA was the only one where travel volumes were lower than 10 years earlier, with 253,220 fewer trips in 2024-25 than in 2014-15. Indonesia, Japan and China had all pushed past their pre-COVID volumes. The USA hadn't.
How Far Below 2019 Is the USA, Really?
The ABS's own year-over-year comparison is useful, but it doesn't tell you where any destination sits against the last "normal" year before COVID scrambled every travel pattern on the planet. So we built that comparison ourselves, straight from the ABS's own data cube.
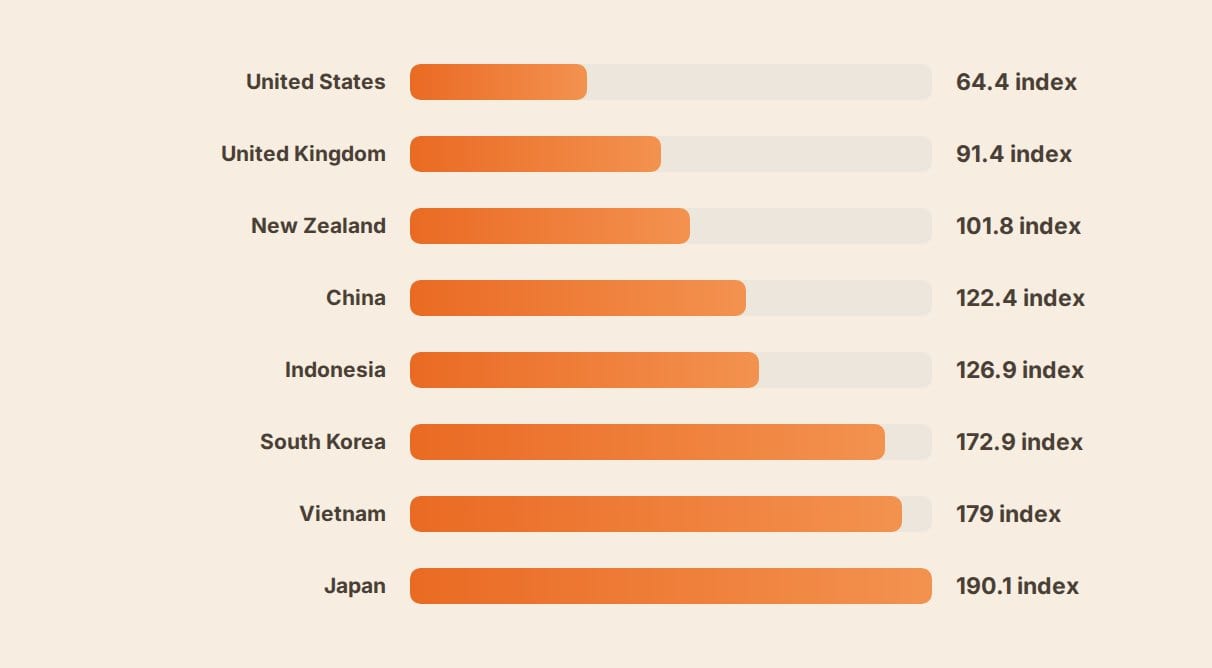
Data: abs.gov.au, abs.gov.au
Here's the method, in full, so you can check it.
- Source Downloaded Table 9, "Short-term Movement, Residents Returning - Selected Destinations", from the June 2026 release, the most recent one published.
- Baseline Summed the 12 months of calendar 2019 for each destination, as the last full, undistorted year on record.
- Current window Summed the most recent 12 months available, July 2025 through June 2026.
- Index Divided the current window by the 2019 baseline for each destination, with 2019 set to 100.
- Why raw totals, not trend Used the raw monthly series rather than the ABS's trend or seasonally adjusted series, because the ABS's own methodology notes confirm those series were suspended in February and April 2020 respectively, due to the pandemic, and were never fully reinstated for this period.
- Cross-check Confirmed the same file's financial-year sums reproduced the ABS's own published FY2024-25 figures exactly, before trusting any of the other numbers.
| Destination | 2019 (baseline) | Jul 2025-Jun 2026 | Index (2019 = 100) |
|---|---|---|---|
| United States | 1,055,600 | 679,590 | 64.4 |
| United Kingdom | 663,430 | 606,090 | 91.4 |
| New Zealand | 1,462,830 | 1,489,460 | 101.8 |
| China | 607,730 | 743,970 | 122.4 |
| Indonesia | 1,400,720 | 1,777,280 | 126.9 |
| South Korea | 84,260 | 145,680 | 172.9 |
| Vietnam | 317,090 | 567,460 | 179.0 |
| Japan | 522,160 | 992,550 | 190.1 |
| All destinations | 11,308,900 | 12,711,640 | 112.4 |
Read the index column and the pattern is blunt. Two destinations are still below where they were in 2019, and they are down by very different amounts. The USA is 35.6% below its 2019 volume. The UK is down 8.6%, a real sag but not a collapse. Everywhere else in the table is comfortably ahead, and Australian outbound travel overall is up 12.4% on pre-COVID. Japan is 90.1% above its 2019 volume, nearly double. South Korea and Vietnam aren't far behind Japan's pace.
Our own reproduction of the ABS's numbers matched their published financial-year figures exactly (746,220 for the USA, 910,640 for Japan, 12,261,080 for the national total), which is the point of showing the method rather than just the conclusion: anyone can pull the same spreadsheet and get the same answer.
One more thing the raw monthly data shows that the ABS's own year-on-year framing doesn't say outright: on a full calendar-year basis, Japan first passed the USA in 2024, not 2024-25. Calendar 2024 recorded 798,710 returns from Japan against 735,210 from the USA. That's our own calculation from the same Table 9 series, not an ABS-published line, but it's the same underlying numbers, and it means this isn't a one-year blip. The gap has been open for at least two years running and it's widening, not narrowing: in June 2026 alone, the most recent month in the release, 61,650 Australians returned from Japan against 52,030 from the USA.
What's Actually Measurable in the "Why", and What Isn't
This is where a lot of travel writing gets lazy and picks a villain. We're not going to do that, because the honest answer is that some of the competing explanations can be checked against hard numbers and some can't.
The exchange rate doesn't explain the US side of this
All exchange rates and AUD conversions in this section are as of September 2026, the month this article was checked and published.
The most common guess is that the Australian dollar has weakened, making the USA more expensive. Check the Reserve Bank of Australia's own exchange rate data and that guess doesn't hold up. The Australian dollar averaged USD 0.6962 across 2019. As of 9 September 2026, it's sitting at USD 0.7232, meaning it's slightly stronger against the US dollar than its 2019 average, not weaker.
| Currency pair | 2019 average | 9 September 2026 | Change |
|---|---|---|---|
| AUD/USD | USD 0.6962 | USD 0.7232 | +3.9% |
| AUD/JPY | JPY 75.90 | JPY 110.85 | +46.0% |
Source: Reserve Bank of Australia, F11 historical and current exchange rates.
Japan is the opposite story, and it's the strongest single measurable factor in this whole piece. The Australian dollar bought an average of JPY 75.90 across 2019. On 9 September 2026 it buys JPY 110.85, about 46% more yen for the same Australian dollar. A JPY 3,000 bowl of ramen (about A$27 at September 2026 rates) that would have cost roughly A$40 in 2019 money. That's not a vibe. That's arithmetic, and it's the clearest reason Japan specifically, rather than "Asia" generally, is where a large share of the redirected travel has landed.
A real, dated cost increase, but a small one
Australia travels to the USA visa-free under the Visa Waiver Program, which means an ESTA, not a visa. On 30 September 2025, the ESTA fee rose from USD 21 to USD 40, a jump of roughly 90%, under fee changes tied to the FY2025 reconciliation legislation known as H.R. 1. Check the current fee before you pay it, at the official ESTA application site only, never a third-party site that charges a service markup on top. In Australian terms that's about A$29 becoming about A$55 at today's rate, a real cost but not a large one against an airfare that runs well into four figures. It's worth knowing about before you book. It isn't, on its own, the reason a third of the market disappeared.
ESTA fee for Australians: USD 21 to USD 40 (about A$29 to A$55 at September 2026 rates), effective 30 September 2025. A one-off cost per trip, not per person per year.
Documented, but not something this dataset can size
Australia's own Smartraveller advice for the USA sits at the lowest level, "exercise normal safety precautions", as of its most recent update checked in September 2026. It's not a warning. But the same advice is explicit that US border officers "have broad powers to decide if you're eligible to enter" and can refuse entry for a wide range of reasons, which is a genuinely different framing from the pre-2020 version of that same advice.
At the US end, a Congressional Research Service report from July 2025 lists the developments observers have pointed to for a broader slowdown in international arrivals to the USA: "lengthy visa interview wait times, stricter border and immigration policies, potential tariffs, the dollar's strength, and U.S. travel restrictions for certain countries." The same report notes that international visitor numbers to the USA reached 72.4 million in 2024, still short of the 79.4 million recorded in 2019, and that year-to-date arrivals through May 2025 were down 2.4% on the year before. None of that is specific to Australia, and the report doesn't isolate an Australian figure. It's real, it's official, and it's simply not a number we can attach to Australians specifically without inventing one. So we won't.
So airline seat capacity on the Australia-USA route is worth naming too, and it's genuinely mixed rather than a clean decline. BITRE's international airline activity data tracks flights and available seats by country, and reporting on specific 2026 route changes shows carriers cutting some city pairs (Melbourne-Dallas was withdrawn, Brisbane-Chicago suspended) while adding capacity elsewhere on the same network. We couldn't pin down a single clean Australia-USA seat total for this piece inside the ABS's own data, so we're naming it as a candidate and leaving it there rather than attaching a number to it.
Why Japan, Specifically

Photo: Marco Almbauer · CC BY-SA 4.0, via Wikimedia Commons
Strip out the currency effect and Japan still has two things going for it that the USA doesn't: geography and novelty. It's a shorter flight from Australia's east coast than the US mainland, direct services run from several Australian gateway cities, and for a huge share of Australian travellers it's still a first visit rather than a repeat one. Indonesia has held the top destination spot for years on cost and proximity alone (see our guide to Bali entry requirements for Australians if that's the trip you're actually planning). Japan is doing something rarer: converting a weak currency into a genuine new habit, not just a cheap one-off.
China shows a smaller version of the same pattern (up 22.4% on 2019), helped by visa-free entry for Australians, which is itself scheduled to end on 31 December 2026. South Korea and Vietnam, both up more than 70% on 2019, round out a genuinely regional shift rather than a single-country story. If there's a theme, it's not "everyone loves Japan". It's that North Asia and South East Asia got measurably cheaper and more convenient for Australians at exactly the moment the US got measurably more expensive and, per the documented factors above, harder to feel confident about.
What This Means If You're Actually Booking
None of this is a reason to cancel a US trip you've already planned, and it's not a verdict on any specific city, family visit or bucket-list stop. It's an aggregate national pattern across 12 million-plus trips a year. Here's how to use it rather than just read it.
Take a Brisbane family of four pricing a December break in Los Angeles against one in Osaka. The ESTA line item for that family now runs about A$220 (4 travellers at USD 40, roughly A$55 each), against about A$116 in 2019 terms (4 at USD 21, roughly A$29 each). That's a real line item, and it sits on top of the airfare, not inside it. The yen discount works differently. It doesn't touch the airfare at all. It shows up later, in the roughly 46% more spending money the same Australian dollars buy once they've landed, on meals, hotels and trains. Same comparison, two completely different places for the cost or the saving to actually show up.
- Check the current ESTA fee (USD 40) before you book, budget it in AUD at the day's rate, and keep the approval with the rest of your paperwork on our travel document checklist
- If you're comparing the USA against an Asian alternative on cost, price the flight and the ground cost separately. The exchange rate helps most with everyday spending, not the airfare
- If Europe is also on your shortlist, check what's actually required before you fly. Requirements for Australians (ETIAS, the UK ETA) have changed since you last looked
- Factor in Australia's own outbound costs too. The Passenger Movement Charge (departure tax) applies no matter which country you're flying to
- If a stopover is unavoidable on your route, check its own transit visa rules separately. It's a different country's requirements, not an extension of your destination's
Where This Pattern Doesn't Hold
A national aggregate can hide a lot. Family reunions, weddings and work travel to the USA aren't price-sensitive in the way a discretionary holiday is, and the ABS data can't and doesn't separate purpose of travel by country in the way it does for Indonesia's overwhelmingly holiday-driven numbers. A Perth traveller flying direct to Tokyo is having a different trip, and doing different maths, to someone flying Brisbane-Los Angeles for a cousin's graduation. If your reason for going is fixed, none of this index changes it. What it changes is the decision for the roughly one in three Australians who, on the data, chose somewhere else.
Frequently Asked Questions
Has Japan actually overtaken the USA as an Australian destination, or is this one unusual year?
It's now at least two years running. The ABS's own 2024-25 financial year figures put Japan ahead (910,640 trips to 746,220), and our own reproduction of the raw monthly data shows Japan also ahead on a full calendar-year basis in 2024 (798,710 to 735,210) and further ahead again in the most recent month on record, June 2026.
Is the Australian dollar weaker against the US dollar than before COVID?
No. It averaged USD 0.6962 across 2019 and sat at USD 0.7232 on 9 September 2026, according to the Reserve Bank of Australia. It's marginally stronger, not weaker, which rules out a weak AUD as the reason USA travel from Australia is down.
How much has the ESTA fee gone up for Australians travelling to the USA?
It rose from USD 21 to USD 40 on 30 September 2025, roughly a 90% increase, driven by fee provisions in the FY2025 reconciliation legislation. In Australian dollars that's roughly A$29 becoming roughly A$55 at September 2026 rates, a real cost but small next to a full international airfare.
Why is Japan cheaper for Australians right now?
Mainly the yen. The Australian dollar buys about 46% more yen now than its 2019 average, per RBA figures. That discount shows up in everyday costs like meals and hotels, not in the airfare itself, which is priced in a mix of currencies and fuel costs.
Is it unsafe to travel to the USA as an Australian right now?
Smartraveller's overall advice level for the USA remains "exercise normal safety precautions", the lowest tier, as of its most recent update. The same advice does flag that US border officers have wide discretion over entry decisions, which is a documented change in framing rather than a safety downgrade.
Which destination has grown the most since 2019 among Australia's top outbound markets?
By our index, Japan leads the major destinations at 190.1 (2019 = 100), meaning short-term returns are running about 90% above pre-COVID levels. Vietnam (179.0) and South Korea (172.9) aren't far behind.
Where can I check this data myself?
The ABS publishes it monthly at Overseas Arrivals and Departures, Australia. Table 9, "Short-term Movement, Residents Returning - Selected Destinations", is the specific file this article's index is built from.
Key Takeaways
- The USA is the only one of Australia's five biggest destinations still below its 2019 level, and by far the largest shortfall of any destination. Our index puts it at 64.4 against a 2019 baseline of 100, the sole entry in negative territory among Australia's top outbound markets.
- Japan overtook the USA in the ABS's own numbers, and it's not a one-off. 910,640 trips to Japan against 746,220 to the USA in FY2024-25, with Japan also ahead on a calendar-year basis since 2024.
- Exchange rate explains Japan, not the USA. The Australian dollar is roughly flat against the US dollar since 2019 but up about 46% against the yen.
- The ESTA fee increase is real (USD 21 to USD 40) but small next to the total cost of a US trip. Budget it, don't blame it.
- Border sentiment is documented but not quantifiable for Australians specifically. Treat it as one input among several, not the whole explanation.
- Whichever destination you land on, check the fee, the rate and the tax before you book. Tools like TripProf keep the ESTA fee, the exchange rate and Australia's own departure tax in one trip file instead of five browser tabs.
Sources
- Australian Bureau of Statistics, Overseas Arrivals and Departures, Australia, June 2026: primary release and Table 9 data cube used for the pre-COVID index
- Australian Bureau of Statistics, Overseas arrivals and departures, Australia, 2024-25 financial year: official Japan-overtakes-USA and 10-year comparison figures
- Reserve Bank of Australia, exchange rates: current AUD/USD and AUD/JPY rates
- Reserve Bank of Australia, F11 historical exchange rates: 2019 baseline exchange rate averages
- Department of Foreign Affairs and Trade: ESTA and Visa Waiver Program requirements for Australians
- Smartraveller, USA travel advice: current advice level and border entry guidance
- Congressional Research Service, Recent Developments in International Tourism to the United States, 31 July 2025: documented factors and US-wide arrival trends
Keep Reading
More travel tips and guides picked for you
What counts as visiting a state? Layovers, drive-throughs and the rules 50-staters use
Only 2% of Americans name a plane change as the minimum that counts as visiting a state, while 27% set the bar at driving through. Here's a three-tier rubric, a lookup table for the edge cases from Four Corners to D.C., and one trip counted three ways.

The fake SBB ticket website stealing credit card and Twint data from travelers
Zurich cantonal police confirmed a fake SBB ticket website is stealing credit card and Twint payment details from travelers who find it through an ordinary Google search. Here is how to spot it and what to do if you already paid.

UK ETA scam warning: fake websites are charging Austrians up to €900
Fake UK ETA websites are charging Austrian and EU travellers hundreds of euros for a form that costs £20. Here's how the real one works, and how to spot a scam before you pay it.